
Introduction
If you’ve been looking for a way to display performance and capacity data for your storage and compute infrastructure, you’ve come to the right place!
In the sections below, I will detail how to install and configure Grafana, InfluxDB, and the scripts you will need to make API calls and send your data to the time series database (InfluxDB). Finally, we will cover Grafana dashboards and I will link to some of ours that will help get you started.
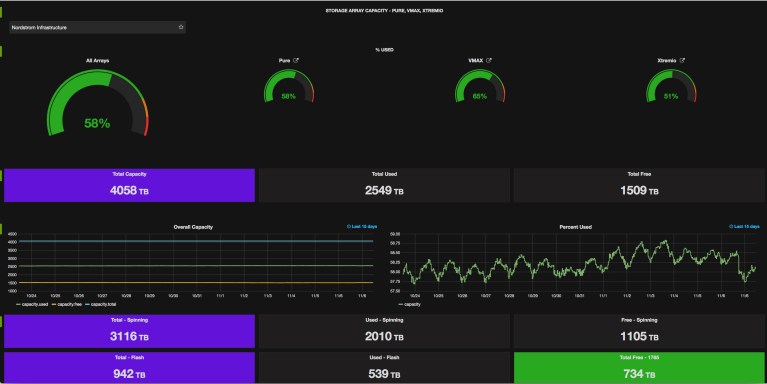
Here’s a sample screenshot from one of our arrays. I’ll include more pics at the end, but this should give you an idea of what you can do with Grafana.
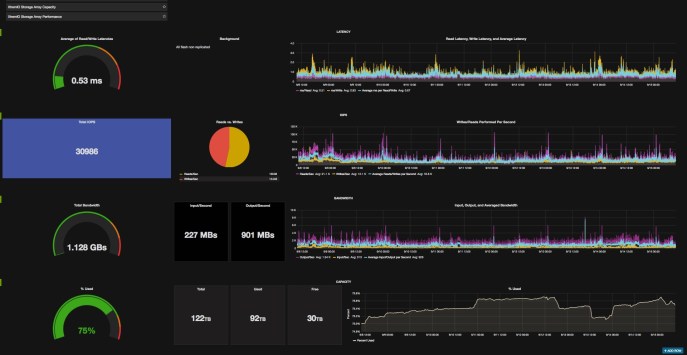
XtremIO Array in Grafana
Things You Will Need
- One or more Linux virtual machines (VM’s). You can do all of your testing and development using a single VM if you want or you can go ahead and build 2 or 3 to use. They don’t need to be particularly beefy, I ran both the database and Grafana on the same single CPU RedHat 6 server with 4GB memory and it was fine. Depending on your hypervisor and version of Linux, you can likely hot-add later if needed. Below, under Example Configuration, I show what we use in production (3 VM’s, one for data gathering, one for the database, and one for Grafana).
- The next items will have their own sections below the Example Configuration.
- InfluxDB. This is our time series database.
- API credentials on the storage arrays.
- Data gathering scripts.
- Grafana. Used to present the data we are collecting.
Example Configuration – Network Diagram

Basic Metrics Gathering Design
As you can see in the diagram, we run three separate nodes for this process. One server (y0319p606) runs scripts called by cron which make the API calls to the storage arrays and then take that data and stuff it in the time series database (y0319p10019). Grafana (y0319p10018) connects to the database and displays the data.
I have included Telegraf and Kapacitor on the diagram as they are additional things you can add to this process. Telegraf is a monitoring client and Kapacitor does monitoring and alerting. I will not be covering them today, check out InfluxData’s website for more information.
InfluxDB
For my time series data, I chose InfluxDB: https://docs.influxdata.com/influxdb/v1.0/
Q: Why InfluxDB?
A: Great performance, fairly easy schema design (it uses tags), good ecosystem (lots of tools that integrate with it), open source, decent documentation and online learning resources, etc.
In a nutshell, the database itself is really cool, but InfluxData also provides Telegraf, an agent for gathering metrics from nodes, and Kapacitor, which enables alerting and monitoring as well as advanced data analysis. My thinking was that if the database worked out well, we might be able to leverage other pieces of their ecosystem.
They have excellent learning resources. The link above will take you to their docs, but they also offer online video tutorials and webinars.
I used RedHat 6 with one CPU and 4GB memory for the database server. We can hot-add resources so I went small to start with and so far, after 6 months it’s holding up just fine.
Installation
Click here to see the official doc.
We don’t connect to non-RedHat repositories, so I downloaded and pushed (using scp) the rpm to my server. Then I installed it locally:
sudo rpm -Uvh/tmp/influxdb-1.0.3.x86_64.rpm
Configuration
Next, I created and mounted a new u01 filesystem using the second disk on the server. I wanted the database on it’s own filesystem to prevent potential issues in the future (like filling root up). My filesystem is 100GB and so far we are at 1% usage. InfluxDB is very efficient!
sudo pvcreate /dev/sdb

Physical volume "/dev/sdb" successfully created

sudo vgcreate vg01 /dev/sdb

Volume group "vg01" successfully created

sudo lvcreate -l 100%FREE -n vol01 vg01

Logical volume "vol01" created.

sudo mkdir /u01

sudo /sbin/mkfs.ext4 -L /u01 /dev/vg01/vol01

sudo vim /etc/fstab

sudo mount /u01

sudo mkdir -p /u01/db/prd/influxdb/data

sudo chown -R influxdb:influxdb /u01/db/prd/influxdb
Then, I customized an entry in the InfluxDB configuration file to change the data path (where it stores the database data files) to /u01/db/prd/influxdb/data (so using the new filesystem I created above), set InfluxDB to start at boot, and started the database.
sudo vim /etc/influxdb/influxdb.conf

sudo /sbin/chkconfig --add influxdb

sudo service influxdb start

Starting influxdb...

influxdb process was started [ OK ]
Now we need to create the database and user using the influx command. Typing influx will open a Command Line Interface (CLI) to the database software. From here you can create/administer databases, users, etc.
influx

Connected to http://localhost:8086 version 1.0.x

InfluxDB shell 1.0.x

>

> CREATE DATABASE metrics

>

> USE metrics

Using database metrics

> CREATE USER metricman WITH PASSWORD 'Chang3me!'

>

> GRANT ALL ON "metrics" TO "metricman"

>
I created a database named metrics and only one user (metricman), but you could create a read only user for the Grafana connection and then a write or all user for inserting your data points.
Look here for information on managing users.
Right on, we have our database and a user to connect to it. Next we will generate API credentials for use in our scripts.
API Credentials
This will vary depending on the storage array. I will give a couple of examples, one using Pure and another using XtremIO. Look up your vendor’s documentation (usually searching for an API doc or guide will lead to the right place) if you are using different arrays.
Pure
You could use the built in pureuser account and for testing it might be the fastest way to go. We use LDAP with our arrays and so I generate a token for the service account that will be running the script. I will show the pureuser way, but feel free to use any other account that has access to the array.

Get API token for Pure array
Log into the Pure array, choose System, Users, Local Users, and then click the little gear next to pureuser (see picture above). Click Show API Token to get the current token. If there isn’t one, click Create API Token to make one.
We will place this token in a json configuration file and it will be called from the data gathering scripts.
Now on to XtremIO.
XtremIO
You will need to create or use an existing user.
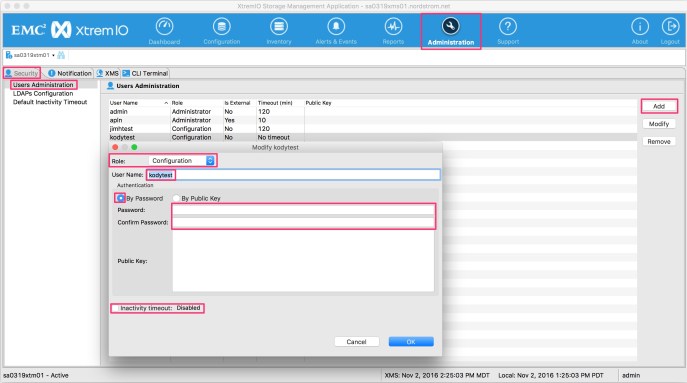
XtremIO Users
Load up the XtremIO Storage Management Application, click Administration, Security, Users Administration, and then Add. A window will pop up and here you will want to set the Role to either Configuration (if you intend to also provision with this user) or Read Only if you are only using the account for metrics (for GETS with the API). Set the password and then click Inactivity timeout if you want to have sessions auto disconnect after a specified time.
Now, we are not quite done with our set up for XtremIO. Instead of using a token like Pure, it expects a user and pass with basic authentication. We will cover this more later, but for now know that you need to go to:
Put the user and password in the form like this, user:pass, and then encode. This base64 encoded string is what you will use to authenticate.
Data Gathering Scripts
If you want to use my scripts, you will need to install Ruby and a ruby gem that I wrote called Stoarray.
- Install Ruby version 2.1+
- gem install stoarray
Both XtremIO and Pure are supported. The gem helps set up the API calls and combined with the scripts, should have you in business rather quickly.
Location of data gathering scripts: https://github.com/kodywilson/metrics
In addition to the scripts, you need .json files containing parameters. I do it this way partially because I don’t want to worry about accidentally putting credentials into source control (*.json is in the .gitignore). Check the README.md in the metrics repo linked above for details on what you need in the .json files and for example cron entries to call the scripts.
Most of our data gathering scripts are running on a VM (named y0319p606 in the network diagram above). I created a /u01/app/prd directory on the server and then sub directories, one for each array type.
Metrics Script Directories
cd /u01/app/prdls -latotal 64drwxr-xr-x 6 root root 4096 May 9 21:13 .drwxr-xr-x 5 root root 4096 May 24 11:27 ..drwxrwxrwx 2 root root 40960 Aug 2 10:10 na_statsdrwxr-xr-x 5 root root 4096 Jul 22 19:02 pure_statsdrwxr-xr-x 7 root root 4096 Aug 3 09:28 vmax_statsdrwxr-xr-x 3 root root 4096 Jul 25 15:03 xtm_stats |
Inside /u01/app/prd you will find sub directories named after array types.
na_stats |
NetApp | Used in a different process. |
pure_stats |
Pure | All Flash – Standard format for scripts. |
vmax_stats |
EMC (VMAX) | Standard format for scripts. |
xtm_stats |
EMC (Xtremio) | All Flash – Standard format for scripts. |
Standard Script Format
The scripts are in cron and run on 1 minute intervals for performance data and 30 minute intervals for capacity.
cd /u01/app/prd/xtm_stats/ls -latotal 24drwxr-xr-x 3 root root 4096 Jul 25 15:03 .drwxr-xr-x 6 root root 4096 May 9 21:13 ..-rwxr-xr-x 1 root root 1735 Jul 25 15:03 perf_tracer_xtremio.rb-rwxr-xr-- 1 root root 1906 Jul 22 19:04 space_tracer_xtremio.rb-rw------- 1 root root 472 Jul 22 18:11 xtremio_stats.json |
Description of standard files and scripts:
perf_tracer_array-type.rb |
Captures IO, Bandwidth, Latency. | Runs every minute. |
space_tracer_array-type.rb |
Captures space used, available, etc. | Runs every 30 minutes. |
array-type_stats.json |
JSON blob containing parameters. | DO NOT CHECK INTO GIT! |
I’m not joking about the .json files, make sure there is an entry in your .gitignore file, DO NOT CHECK INTO GIT!
You will see these patterns repeated for each array type using the standard format. For instance, the performance gathering script will be perf_tracer_pure.rb for Pure arrays and perf_tracer_xtremio.rb for Xtremio arrays.
These scripts connect to the array, pull information, and then write the data into the database using the line protocol.
As a reminder, check the README.md at https://github.com/kodywilson/metrics to see how to set up your .json files and cron jobs.
It probably doesn’t add any security, but I like to base64 encode all credentials stored in the .json files. The scripts are expecting the database user password, Pure token, and Xtremio credentials to be encoded. Follow along with the README.md and it should be clear where this is being done.
You can use https://www.base64encode.org/ to encode things.
At last, we have a database and scripts set up to send information to the database. Before tackling the next section, you could go ahead and add the scripts to cron (assuming you have completed everything up to this point) and then jump on the database server and confirm that gathering is working.
Log on to your database server and run influx to open the InfluxDB CLI. Now use the following two commands to see if data is being gathered.
use metrics

show series
You should see entries in the database, they will look something like this:
performance,array=sa0319ps01,type=Pure
Hopefully that’s working and we can now move on to Grafana!
Grafana
For charting and data visualization, I chose Grafana: http://grafana.org/
Q: Why Grafana?
A: Easy to use GUI, great ecosystem (lots of plugins), open source, decent documentation and online learning resources, etc.
Grafana looks good, supports many data sources, and is very actively developed. With a decent number of pre-built plugins and good documentation, it was fairly easy for me to install and get started using it.
Installation
Pushed the Grafana rpm to my RedHat linux VM and installed it:
sudo yum install initscripts fontconfig

sudo rpm -Uvh /tmp/grafana-4.0.0-1469798582pre1.x86_64.rpm
Allow grafana to bind port 80 or 443:
sudo setcap 'cap_net_bind_service=+ep' /usr/sbin/grafana-server
Configuration
Two major things here.
- We want to run on port 80 or 443 (if using ssl) instead of using iptables to redirect a higher port.
- LDAP authorization needs to be configured. You can skip this if you want to just use the default admin account.
Grafana Main Conf File
As you can see from the code block above I enabled binding to lower ports with the command setcap 'cap_net_bind_service=+ep'
Grafana’s Main Conf File Documentation: http://docs.grafana.org/installation/configuration/
This is the file to edit: /etc/grafana/grafana.ini
Now open the configuration file to enable LDAP auth, configure Grafana to use port 80, and make a few other changes. The headings are clearly marked and below I include all the ones where I changed something.
#################################### Server ####################################
[server]
# Protocol (http or https)
protocol = http
# The ip address to bind to, empty will bind to all interfaces
http_addr = 192.168.1.34 # Put your IP address here
# The http port to use
http_port = 80
#################################### Security ####################################
[security]
# default admin user, created on startup
admin_user = betterbefunny
# default admin password, can be changed before first start of grafana, or in profile settings
admin_password = createsomethingawesome!
#################################### Users ####################################
[users]
# disable user signup / registration
allow_sign_up = false
# Allow non admin users to create organizations
allow_org_create = false
# Set to true to automatically assign new users to the default organization (id 1)
auto_assign_org = true
# Default role new users will be automatically assigned (if disabled above is set to true)
auto_assign_org_role = Viewer
# Background text for the user field on the login page
login_hint = LAN ID
# Default UI theme (“dark” or “light”)
;default_theme = dark
#################################### Auth LDAP ##########################
[auth.ldap]
enabled = true # Change this to false if you will not be doing LDAP auth.
config_file = /etc/grafana/ldap.toml
Grafana LDAP Conf File
This is the file to edit: /etc/grafana/ldap.toml
Grafana’s LDAP Configuration Documentation: http://docs.grafana.org/installation/ldap/
Running Grafana
Start Grafana:
sudo service grafana-server startSet to run on boot:
sudo /sbin/chkconfig --add grafana-serverAdding Your Database to Grafana
Above when you were editing grafana.ini, you should have configured admin_user and admin_password. Now you can use those credentials to log in and begin adding data sources (your InfluxDB database) and dashboards (more on that coming up).
Open your browser and enter the IP address or DNS entry for your Grafana server.
Once you log in, you will see something like this:
Grafana Initial Screen
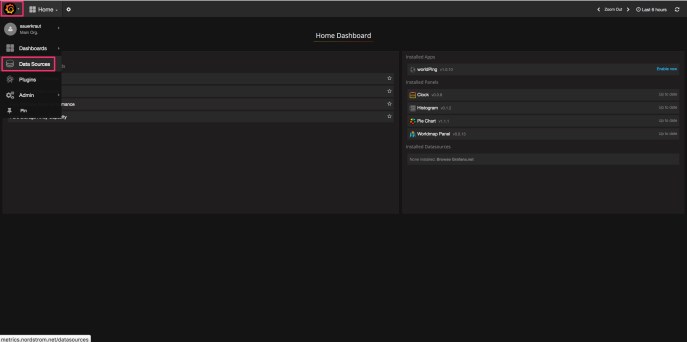
Your view may be pretty much just the top bar and the rest blank as nothing has been added yet. Let’s add our InfluxDB database. Click the orange swirl in the upper left corner and then choose Data Sources.
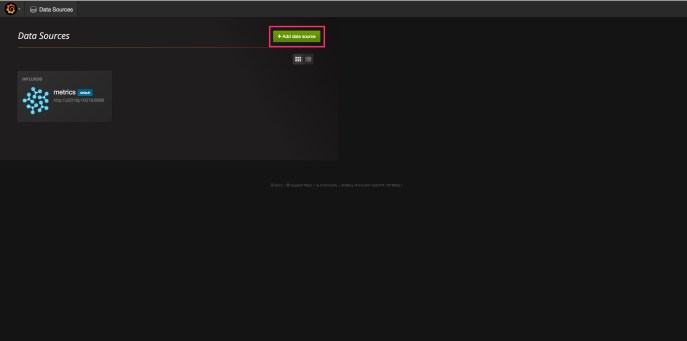
Grafana Add Data Source
Click the green Add data source button and then fill in the form. See my example below for help filling yours out:
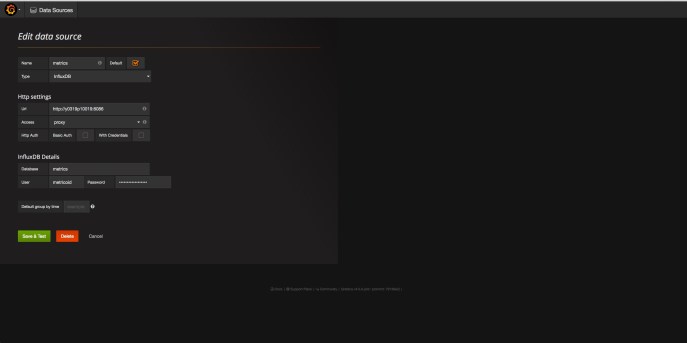
Grafana Data Source Config
When you click save and test, it will try to connect to the InfluxDB database and will let you know if it works ok. Assuming that it does, you are ready to start building/adding dashboards!
Visit my GitHub page for some exported Grafana dashboards that you can import and customize: https://github.com/kodywilson/grafana_dashboards
Here’s a description of how we structure our dashboards. We have a top level view that shows red, yellow, green for both capacity and performance and a list of dashboards (See the first screenshot below). Clicking on either Array Capacity or Array Performance takes you to an overview page with relevant information about all arrays. From there you can drill down to each array type (Pure, Xtremio, VMAX, etc.) or directly to an individual array.
Going to the array type page will show you all arrays of that type (all Pure arrays for instance), if viewing the performance overview you will see latency, bandwidth, and IO while the capacity page will show usage, total, and free.
No matter how you get to an individual array’s page, you will see both performance and capacity information all on one page for that particular array. As a reminder, you can navigate to an array from the big drop down near the orange swirl, from an overview page for that array type, or from the big roll up of all arrays available for both metric groups (capacity and performance).
Clone the repo and then log into Grafana. Click the orange swirl in the upper
left corner and then choose Dashboards.
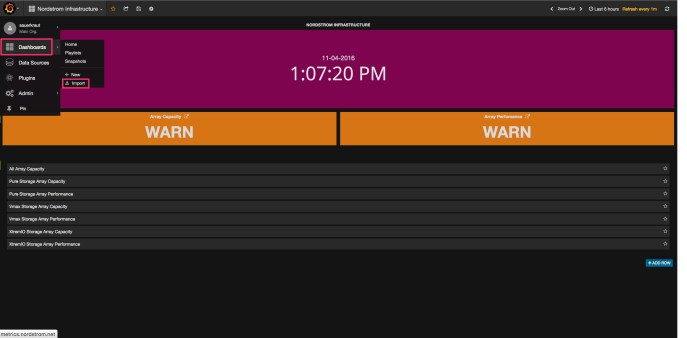
Import Dashboard
Now select Import and then upload file from the dashboards repo you cloned.
The dashboard may automatically load, if it doesn’t, then click the menu selector to the right of the orange swirl and find it in the list.
To customize the dashboard, click any chart or dial and choose edit.

Edit a dial
Now select Metrics and look at the query line, which will usually start with A.

Edit Query
You will need to change the names used in the query to whatever matches your infrastructure.
Change “array” = ‘something’ to your array name.
You can follow this same process for any of the dashboards. Please keep in mind that some of the dashboards link to other ones, I think Grafana calls this a drill down. You can build out a series of linked dashboards that will help users navigate between the different array types. If you were to import all the dashboards in my repo, you would have this basic structure and would just need to customize for your array names and then copy the individual array pages until you have everything covered.
The most laborious part would be fixing all the drill downs to point to the right location. Mine will all be linking to arrays that don’t exist in your infrastructure.
We have a starting page which then links to either Capacity or Performance and from there to each array type and then from there to each individual array. For the individual array pages, you can build one and then copy it and use that copy to build a new one. This way you are not building each one by hand.
Recap!
- Install, configure, and start InfluxDB.
- Create a database and user:pass.
- Get API credentials for your array types.
- Clone data gathering scripts and customize json for your arrays. Don’t forget to check the README for the script repo…
- Test scripts, check database to verify data is inserted and then put scripts in cron.
- Install, configure, and start Grafana.
- Clone my dashboards.
- Import dashboards and customize for your array names.
In Conclusion
Hopefully this gets you well on the road to reporting metrics about your storage arrays!
I’ll try to get some more posts created with more specific information on the dashboards and queries as there is a lot of ground to cover there in order to really understand what is going on with each chart/dial.
We have also played around with sending data from vcenter/vmware including geo-located data displayed on a map. I’ll have to save that for another post, as this one is already gigantic.
Please let me know if anything is unclear and/or what I can do to help make this material more accessible and easier to understand.
